Interactive model explorer (WIP)
The optional modello.gui module renders nested models in a local browser.
Install its separate extra; the base library still depends only on SymPy:
$ pip install 'modello[gui]'
$ python -m examples.gui
From a checkout, use uv run --extra gui python -m examples.gui. Open
http://127.0.0.1:5058.
Curves, areas, and surfaces from one projectile
The default demo reuses examples.projectile, the mechanics model behind
the solution-view gallery. A ball leaves ground level
at 20 m/s, under uniform gravity of 10 m/s², with no air resistance. Combining
every launch direction gives the highest reachable target at each horizontal
location:
This is an envelope of many possible throws. The guided questions open checked charts automatically, with useful display windows:
Safety parabola fixes sideways distance to zero. The curved ceiling peaks at 20 m and meets the ground at horizontal distances of ±40 m.
Reachable area releases target height. The shaded samples describe targets above ground and below that ceiling; colour shows clearance above each target.
Safety paraboloid releases sideways distance instead. Rotate and tilt the curved surface, or switch to Map to inspect its circular ground footprint.
Targets 8–12 m high narrows the reachable area to an elevated band.
Boundary at 10 m observes an envelope height. The same equations now give two symmetric checked horizontal positions, ±20√2 m.
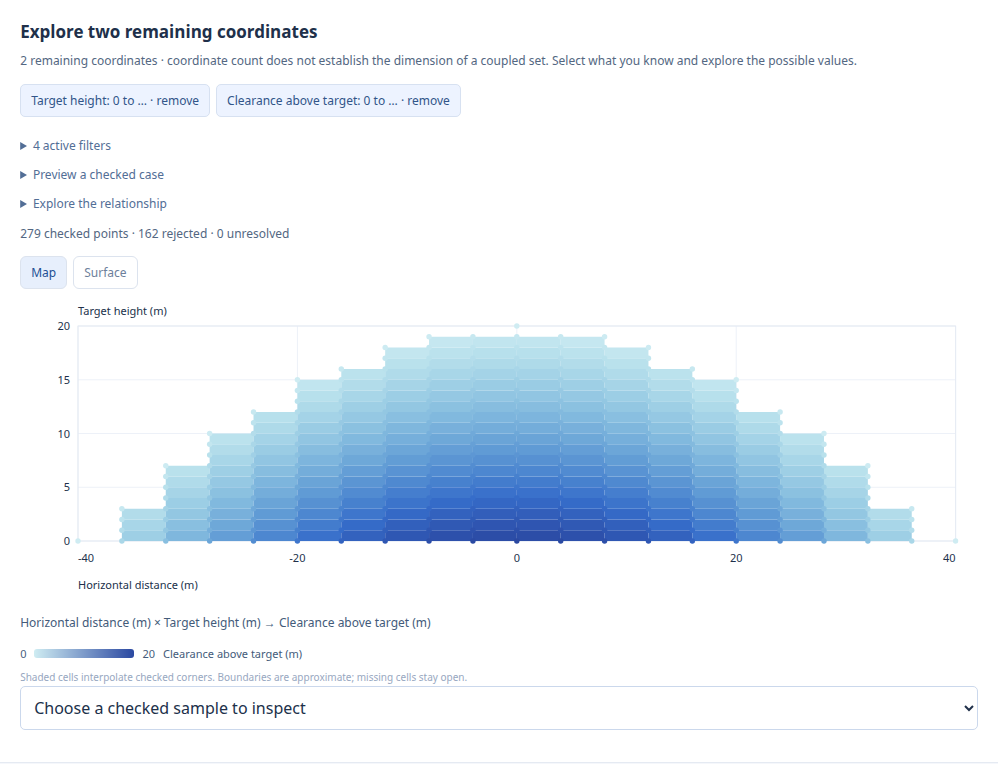
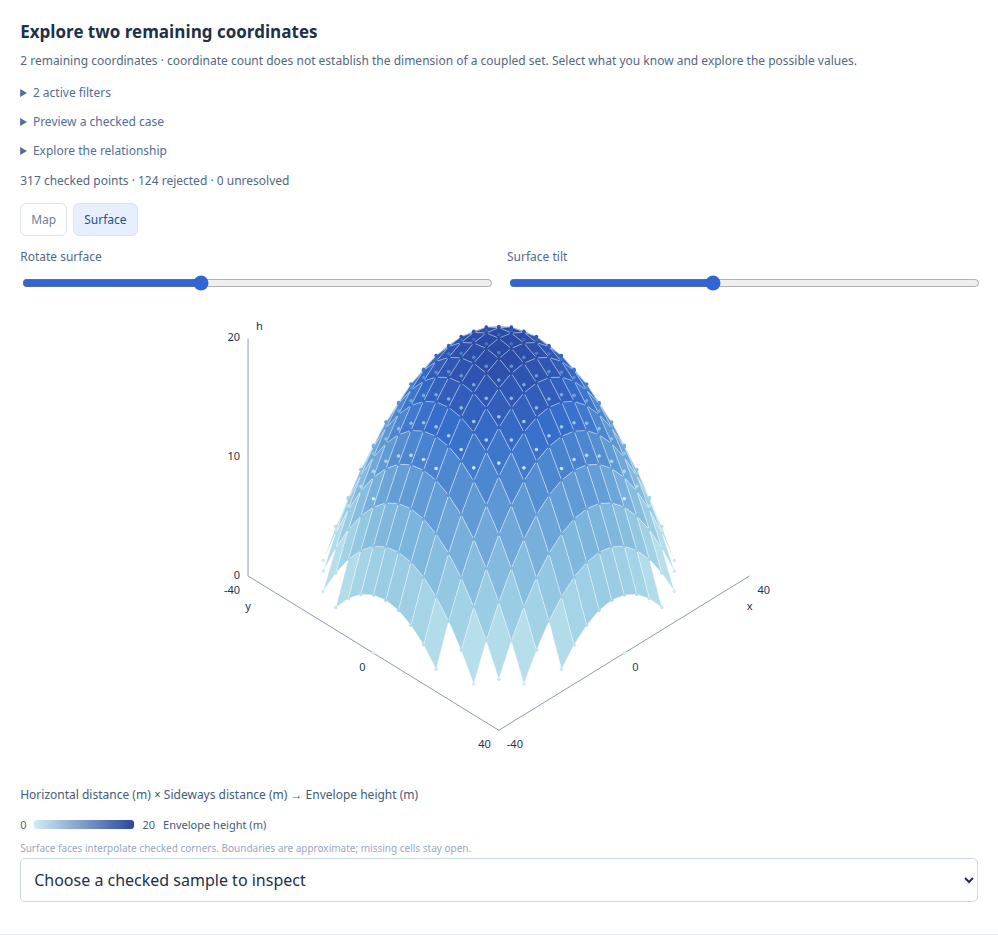
The browser displays curves with one varied control and maps or surfaces with
two. A surface is two-dimensional even though its graph uses three axes.
Families with three or more remaining coordinates can still be inspected
through one- or two-control sections. The browser does not draw volumes;
the earlier examples.solution_views exporter includes a voxel volume
illustration. Coordinate count alone does not certify the dimension of an
implicitly constrained family.
Quickstart: your own explorer
Save this complete example as return_model.py and run
python return_model.py after installing modello[gui]. Open
http://127.0.0.1:5058. From a checkout, the same example runs with
uv run --extra gui python -m examples.gui_quickstart.
from sympy import Rational

from modello import InstanceDummy, Modello
from modello.gui import ModelInfo, Scenario, create_app, gui


@ModelInfo(
    title="Return model",
    description="Explore return and expected gain.",
    initial_field="expected_return",
    highlights=("gain",),
    scenarios=(
        Scenario(
            title="8% return",
            description="Supply a return and calculate expected gain.",
            bindings={"expected_return": Rational(2, 25)},
            select="gain",
        ),
    ),
)
class ReturnModel(Modello):
    expected_return = gui(
        InstanceDummy("return", real=True),
        title="Expected return",
        symbol="μ",
        number_format="percent",
        description="The assumed mean annual arithmetic return.",
    )
    capital = gui(InstanceDummy("capital", positive=True), title="Starting capital", symbol="C", unit="USD")
    gain = gui(capital * expected_return, title="Expected gain", symbol="G", unit="USD")


if __name__ == "__main__":
    app = create_app(ReturnModel, inputs={"capital": 100_000})
    app.run(host="127.0.0.1", port=5058, debug=False)
Capital starts as a supplied input and expected return starts free. Choose 8% return to calculate USD 8,000 expected gain. Change capital to USD 200,000 to see gain update to USD 16,000. Drop the return input to explore the formula again, or supply a gain instead to infer the required return.
Plain model declarations work without presentation metadata. Add gui where
labels, descriptions, symbols, or display formats help. @ModelInfo adds the
model’s text and optional guided questions. Only serving the browser requires
the GUI extra; core annotations and Python snapshots work without Flask.
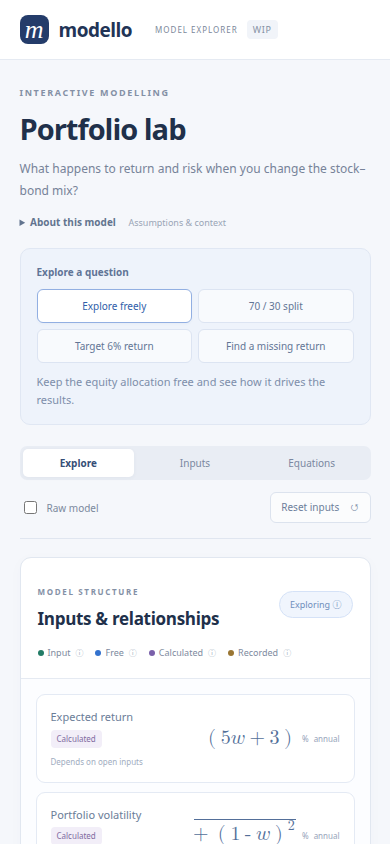
A portfolio to explore
Run python -m examples.gui --demo portfolio for the two-asset mean–variance
portfolio. Equity and bond
assumptions live in nested components, and allocation weights must be
non-negative and sum to 100%. It starts with the equity allocation free,
so the results remain expressions in that unknown.
The illustrative annual inputs are 8% equity return with 20% volatility and 3% bond return with 5% volatility, on USD 100,000 of starting capital. Zero return correlation and a 2% risk-free rate are retained as background inputs. These are supplied assumptions, not estimates from market data.
For equity weight \(w\) and bond weight \(b\), the model relates:
The weighted mean and covariance-based variance follow the standard mean–variance formulation in the CVX short course. The demo evaluates and inverts these relationships; it does not optimise an allocation or estimate return statistics.
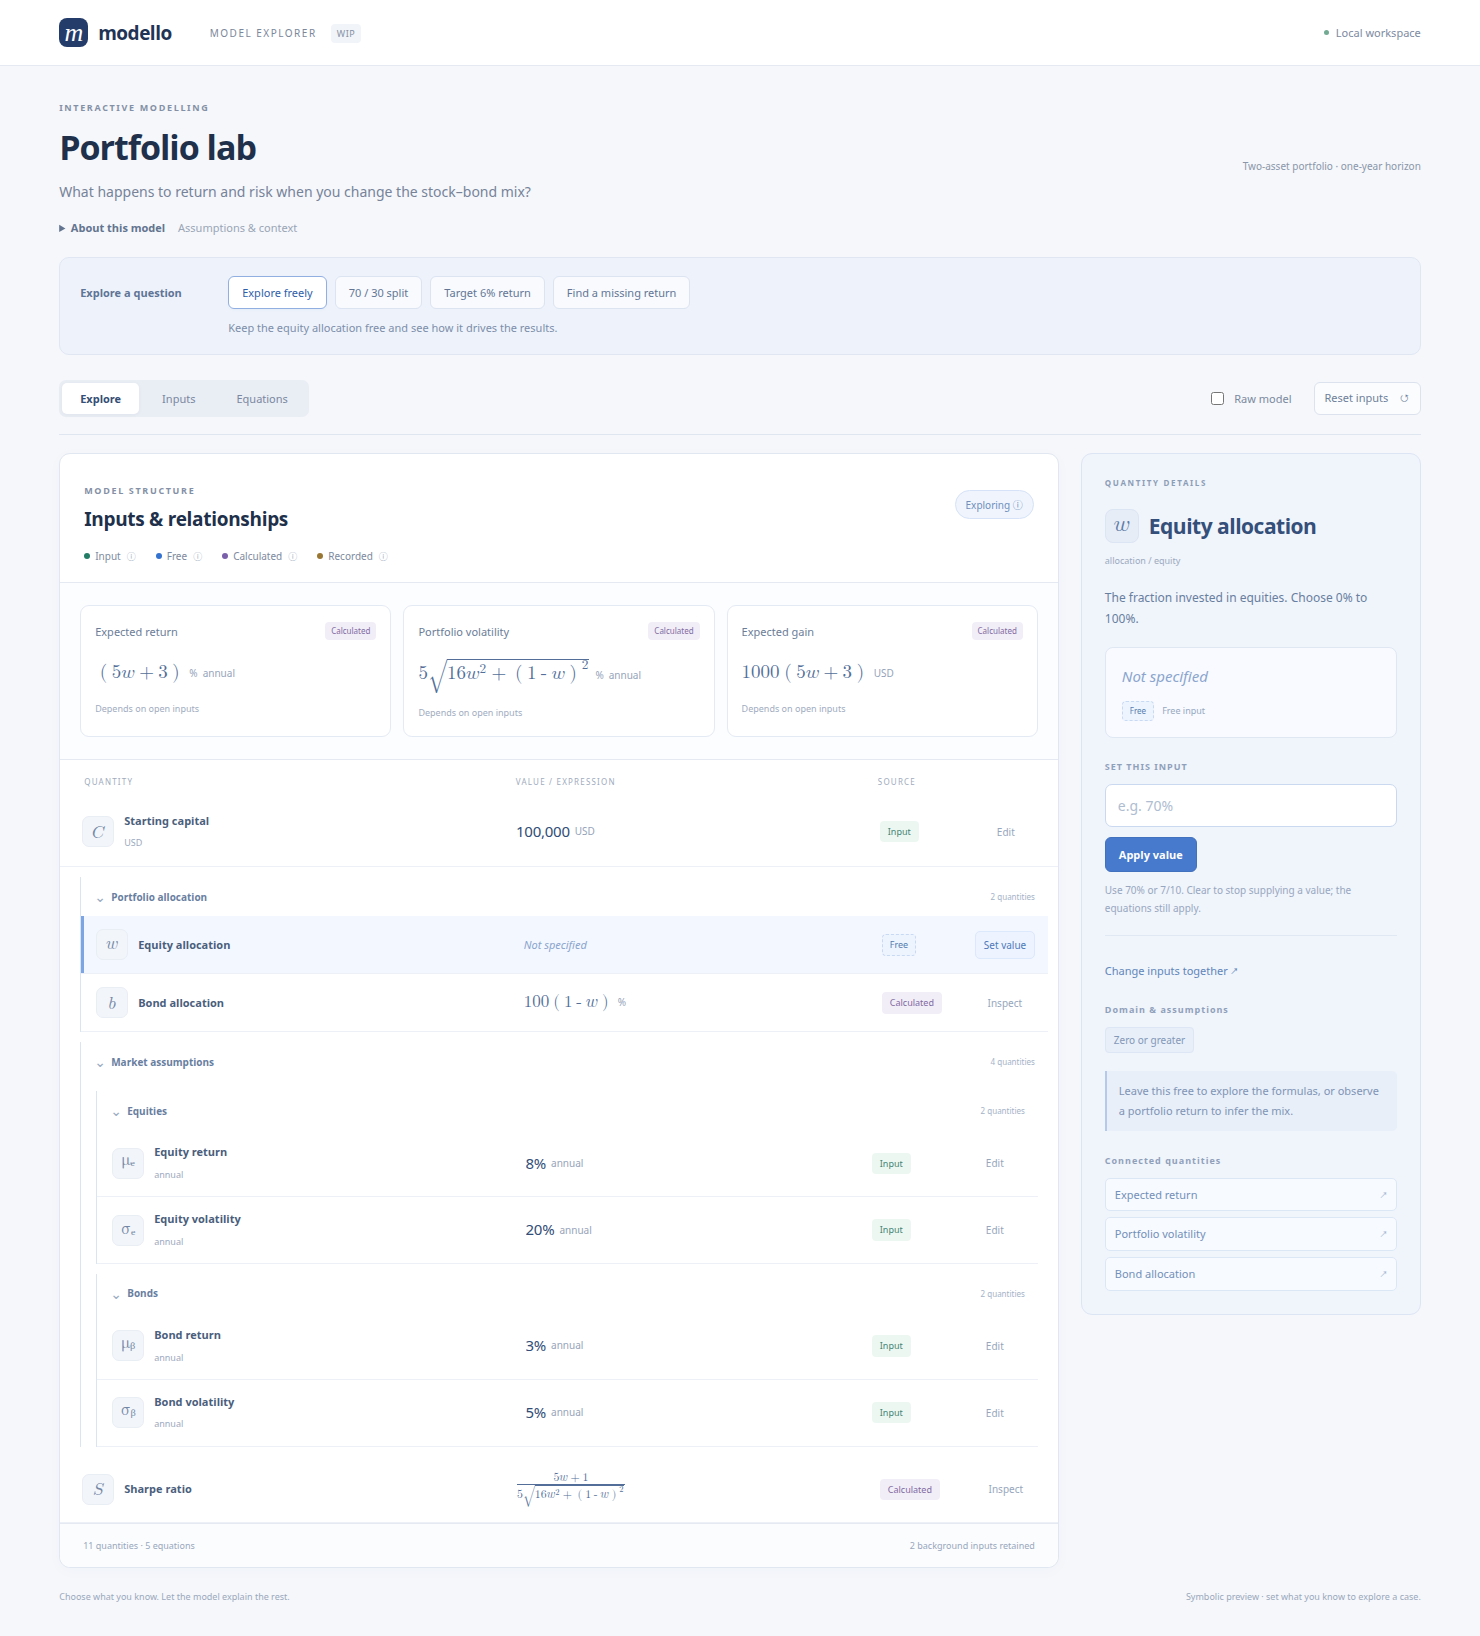
Use the guided questions to see different ways to bind the same model:
Explore freely retains the assumptions and leaves the allocation open.
70 / 30 split supplies a 70% equity allocation. The expected return is 6.5%, volatility is approximately 14.08%, and expected gain is USD 6,500.
Target 6% return observes a result instead of an input. The equations infer a 60% equity / 40% bond mix and USD 6,000 expected gain.
Same risk, two answers observes 5% volatility. Both 0% equity and \(2/17\) equity satisfy it, with different expected returns.
Narrow the answers keeps that risk target and adds a 3.5% minimum expected return. Only the \(2/17\) equity allocation remains.
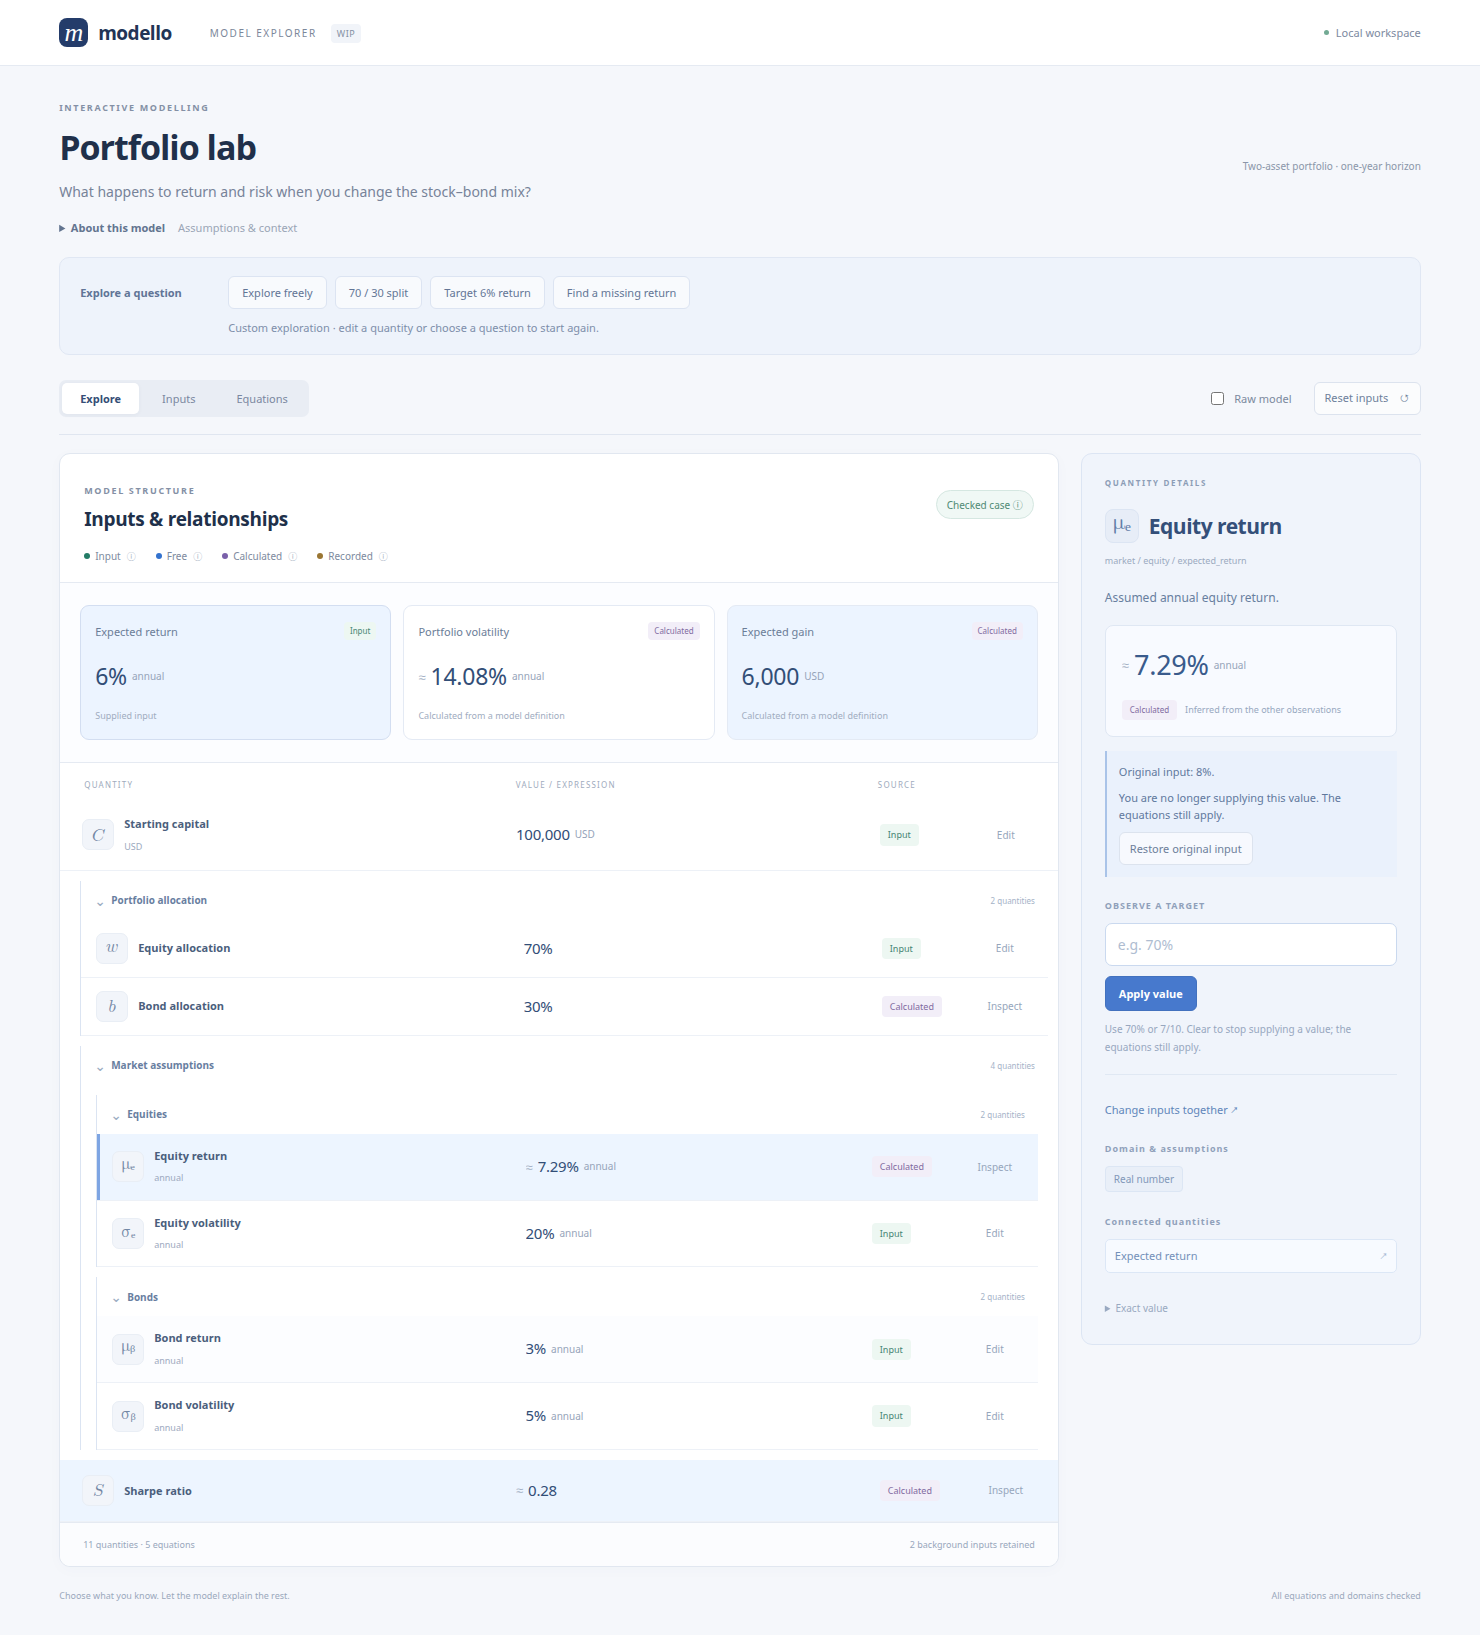
Find a missing return supplies a 70/30 mix, drops the original equity return assumption, and observes a 6% portfolio return. The equations infer an equity return of approximately 7.29%.
Each question restores the initial inputs before applying its observations. Subsequent edits are marked as a custom exploration. Inspect a quantity, enter a value, and choose Apply value or press Enter. Drop input removes a supplied observation; clearing the editor does the same. Try a 120% equity allocation to see an Empty family: its derived bond weight violates the non-negative domain. The observations remain visible so you can inspect the failing domain and revise the question.
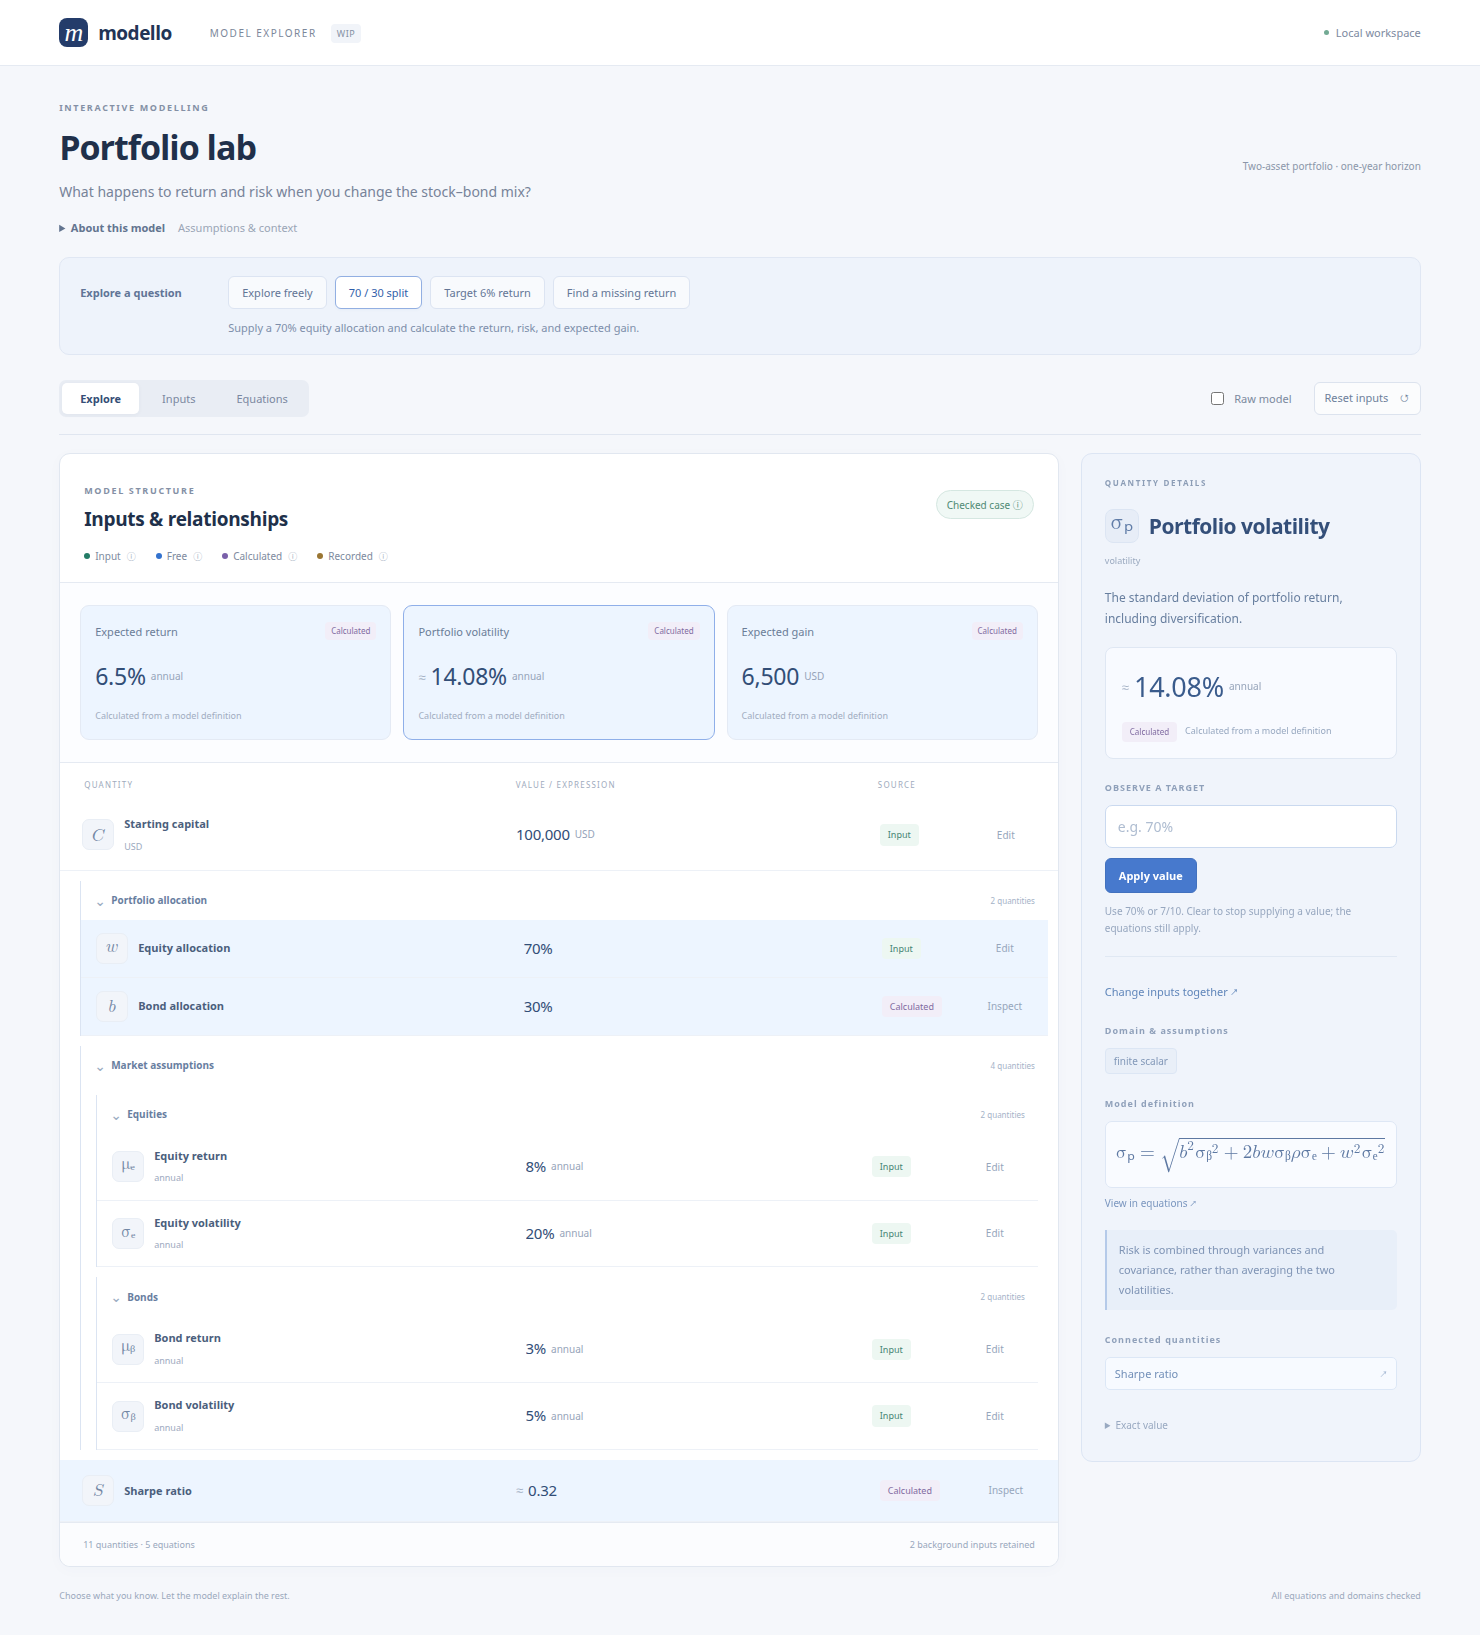
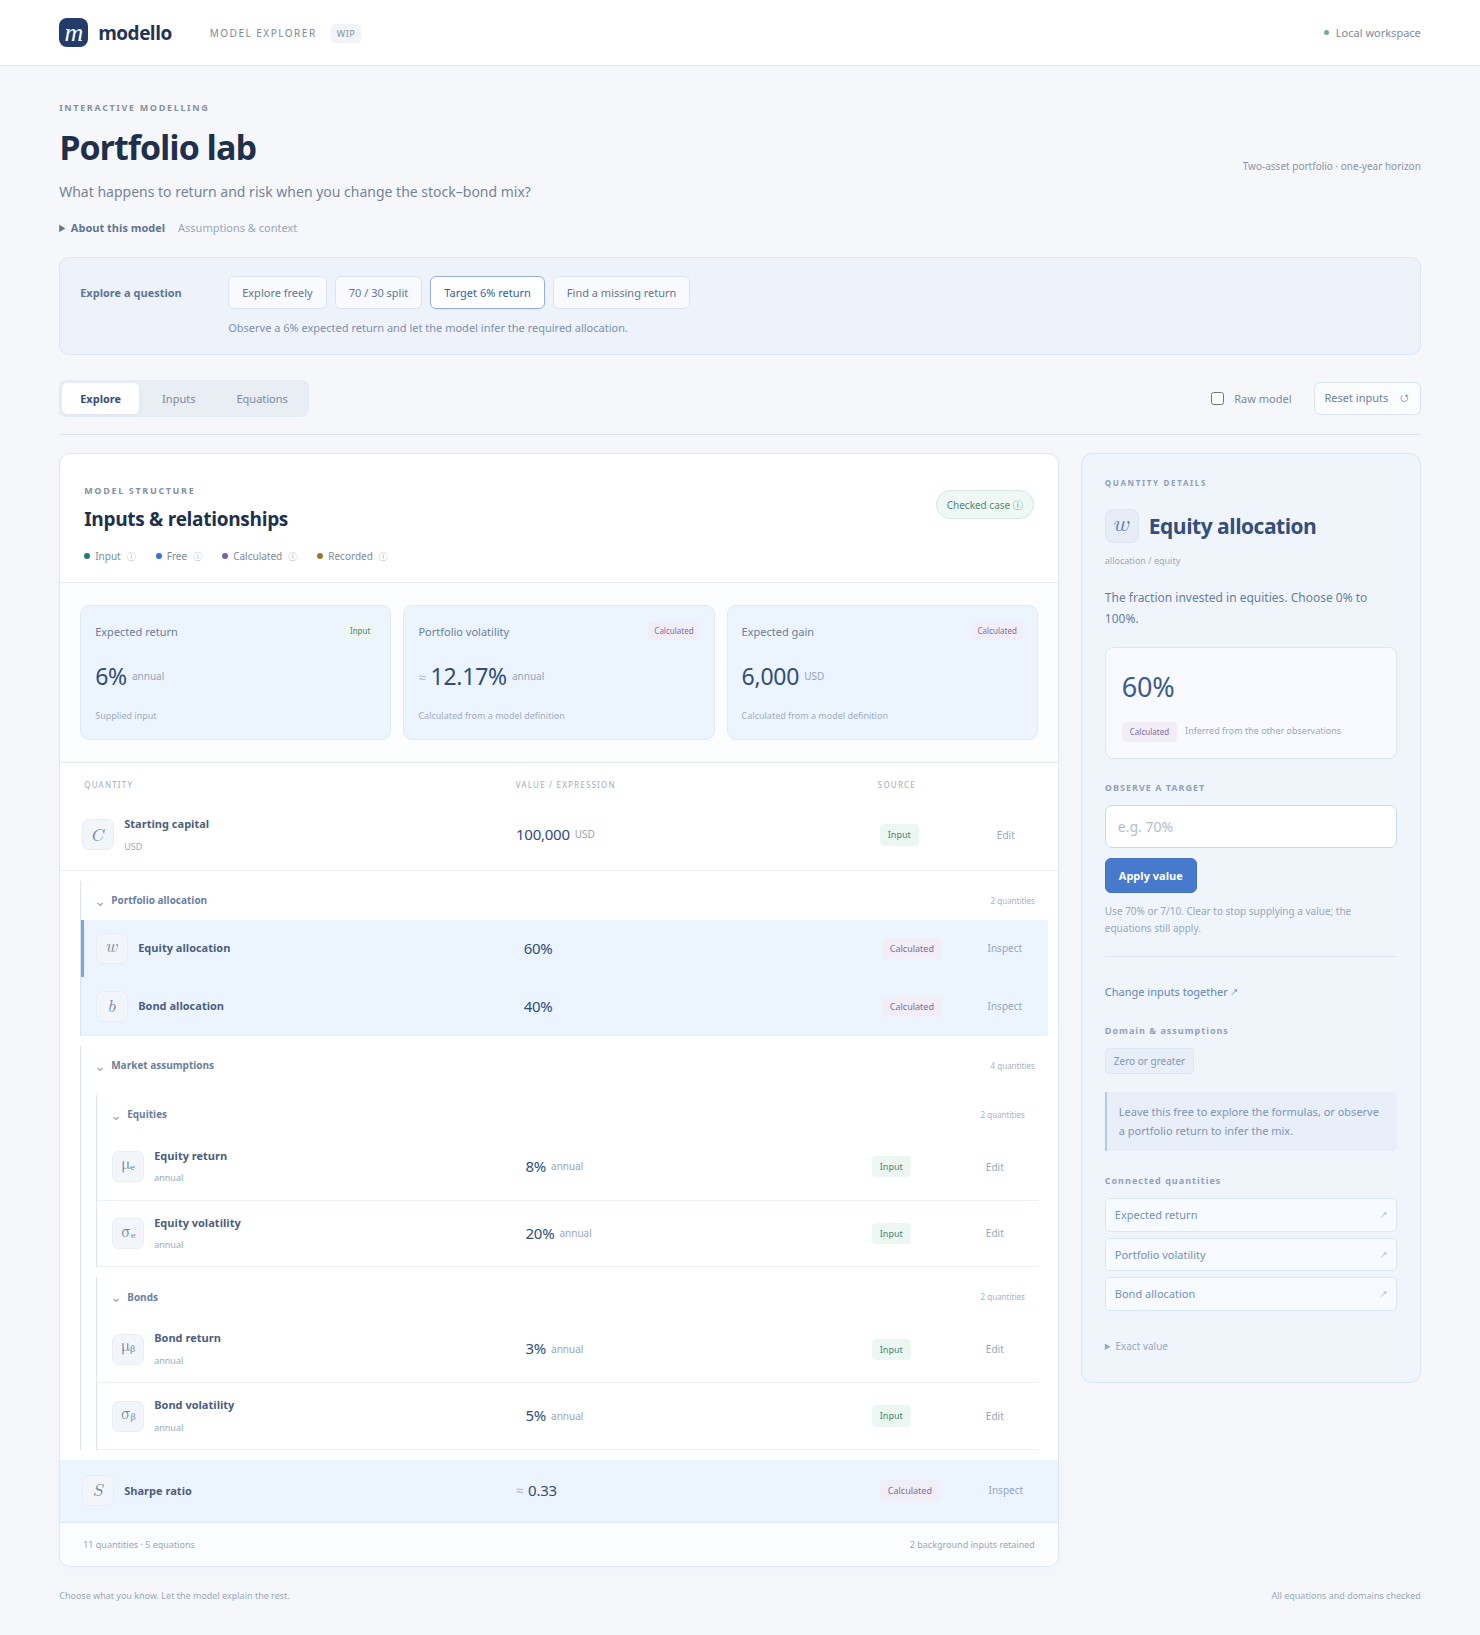
Choosing what you know
An input is a supplied observation, not a permanent role assigned to a field. You can change an original input, drop it, or supply a normally calculated result as a target. Dropping an observation keeps the defining equations: the quantity may become free, or it may be inferred from other observations. Supplying a target adds an observation; it does not replace its equation or silently discard conflicting inputs.
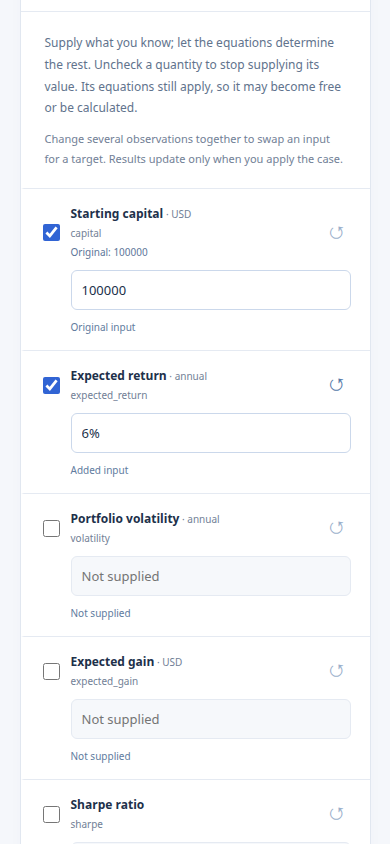
The Inputs view makes this choice explicit. Checked quantities are supplied; unchecked quantities are left to the model. Edit values, uncheck assumptions, or check a result and enter its target. Apply inputs validates all pending changes together. The results continue to show the last applied case until then. Malformed values and directly invalid scalar inputs preserve both those results and the pending changes. A valid question with no feasible answers is applied as an empty family. Discard changes returns the draft to the applied case without solving. The apply controls stay visible while you scroll through pending changes.
The view distinguishes Original, Changed, Added, and Dropped inputs. Each row shows its original supplied value when there was one. Its reset arrow restores that quantity’s original input state in the draft; it does not reset other quantities. Aliases share one observation and one row. Hidden inputs remain active and have no checkbox or editor.
Useful stories to try:
Compare an assumption. Start with 70 / 30 split. Change bond return from 3% to 4%: portfolio return becomes 6.8%. Restore original input in its inspector returns to 6.5%, retaining the 70/30 allocation. This restores only the selected assumption; Reset inputs restores the entire initial model instead.
Stop assuming a value. Drop the equity return input in the same 70/30 case. Equity return becomes free and portfolio return becomes an expression. You can explore this partly specified model without choosing a replacement.
Solve for a missing assumption. In Inputs, uncheck equity return, check expected portfolio return, enter
6%, and apply them together. Equity return is now approximately 7.29% and labelled Calculated, with its original 8% explicitly marked as a Dropped input. The guided question Find a missing return sets up exactly this case.Return to forward calculation. From that case, restore the equity return with its row’s reset arrow and uncheck the portfolio return target. Apply both changes together: the original 8% assumption again produces a 6.5% portfolio return, with the 70/30 allocation retained.
Keeping both the original 8% equity return and a 6% portfolio return target with the 70/30 allocation is contradictory. The empty family retains those observations for inspection. Changing several observations together avoids passing through that contradictory intermediate case.
From a question to its possible answers
The family panel adapts to the reduced model, after observations and aliases have been accounted for:
One closed, audited state is a checked answer.
A small explicit finite family shows checked alternatives side by side. Choose a case to inspect its values. The whole family and all filters remain available; the preview does not turn its coordinates into supplied inputs.
One remaining coordinate offers a response curve. Two offer a flat map or rotatable surface, with the selected output encoded by colour and, on the surface, height.
With more coordinates, preview a checked reference case and choose one or two controls. The other coordinates stay at the reference, producing a section, with those fixed values stated beside the plot.
An established empty family shows no feasible answer. An unresolved audit or implicit set retains its expressions and conditions without claiming existence, uniqueness, or infeasibility.
Coordinate count is not a dimension certificate. Two coordinates can still be coupled by an equality or discrete restrictions. Finite alternatives take priority over coordinate-based plots. At most 32 finite coordinate proposals are materialised automatically; larger finite families need further narrowing or an explicit point preview.
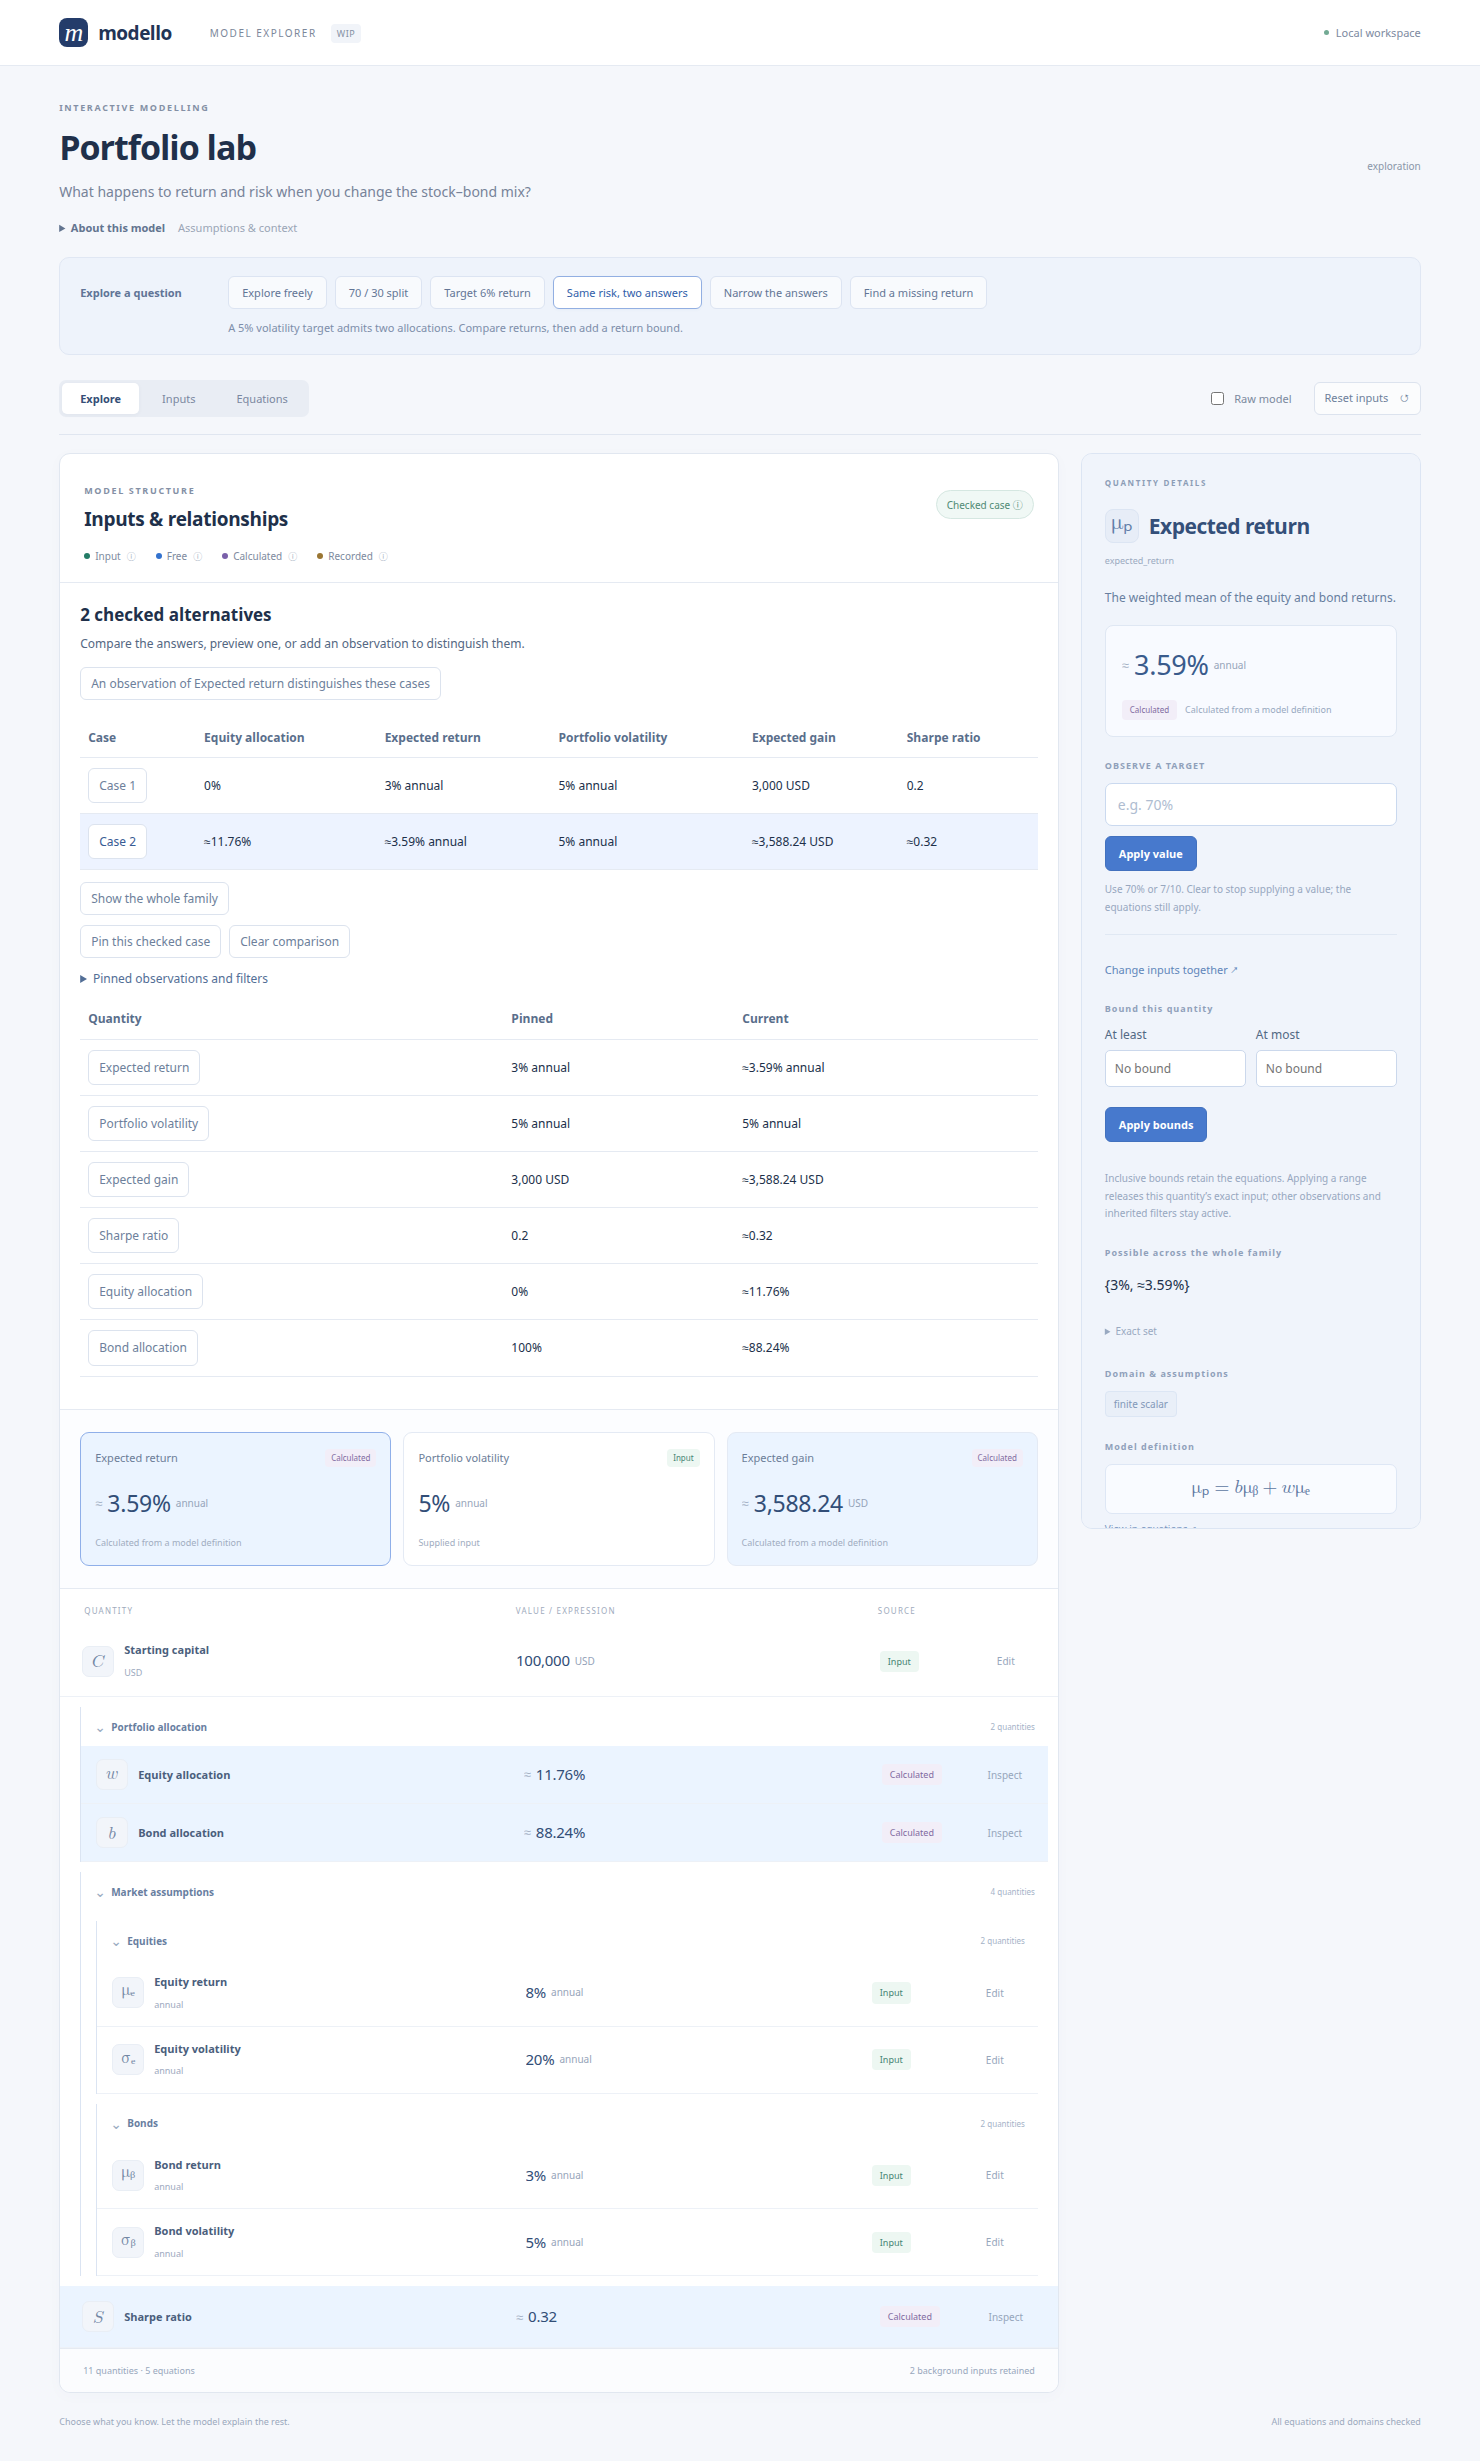
Select Same risk, two answers, inspect Case 1, and choose Pin this checked case. Inspect Case 2 to compare it with the pinned case. The comparison includes changed quantities and highlighted outputs; the pinned observations and filters remain inspectable. Pinning does not change the model. The comparison belongs to the current browser session and is cleared on reload.
For finite checked alternatives, the panel suggests quantities whose observed values would distinguish them. It prefers highlighted outputs and avoids repeating suggestions that separate the same groups of cases. Highlighted outputs independent of the remaining coordinates are identified separately. These statements follow from the equations and audited cases; they do not assign probabilities or rank explanations by likelihood.
In a quantity’s inspector, At least and At most add inclusive bounds. Either endpoint may be omitted. Apply bounds releases an exact input for that quantity and retains every other observation, definition, and filter. Remove bounds removes only those browser-added bounds. Recorded observations cannot be replaced or released: bounding a Recorded quantity intersects its existing restrictions. An incompatible bound produces an empty family. Aliases share their bounds, just as they share observations.
Possible across the whole family keeps intervals, discrete alternatives, and disconnected unions distinct. Exact set retains implicit sets and conditions too. While inspecting one checked case, these sets continue to describe the surrounding family.
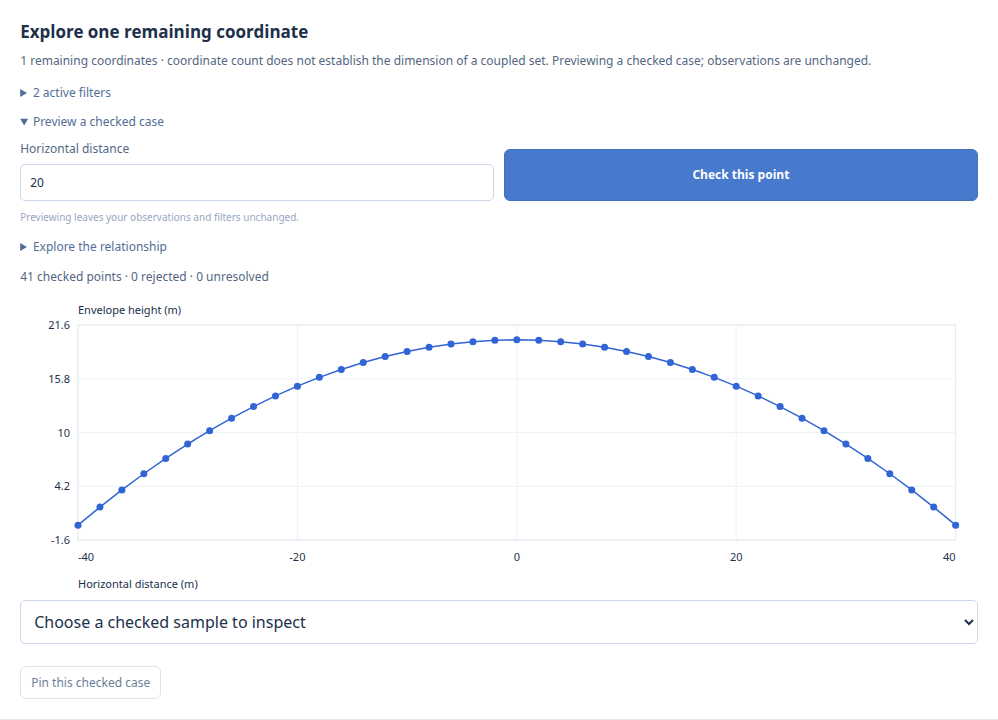
Plot windows are display choices. Finite enclosing coordinate bounds seed the window where available; unbounded coordinates require explicit endpoints. Every plotted point is audited against all equations, assumptions, and family filters. Selecting a point, including through the keyboard-accessible sample picker, opens a checked preview in the original family. One-coordinate plots retain gaps at rejected or undecided samples. Two-coordinate plots audit a 21-by-21 grid and shade only cells with four checked corners. Surface faces interpolate those corners; boundaries and interiors remain approximations. Missing corners leave open cells. The legend gives the sampled output range. The Map and Surface buttons reuse the same checked points without another solve. Native rotation and tilt sliders work with the keyboard too. Empty samples do not establish an empty family, and pictures do not establish global extrema.
Further runnable questions use the same existing example equations:
$ python -m examples.gui --demo calibration
$ python -m examples.gui --demo reachability
The calibration starts with recorded cost in [200, 202], shared impact in [1/4, 3/4], and planned cost in [1026, 1076]. The reachability model retains a coupled set over forward distance, sideways distance, and target height. Preview (0, 0, 0), then take a one- or two-coordinate section through that case. For one-coordinate families, constant exact derivatives can also relate quantities with matching display units. The calibration explains that each 1 USD change in recorded cost corresponds to 25 USD in planned cost. Nonlinear or unresolved derivatives are not promoted to a constant response relationship.
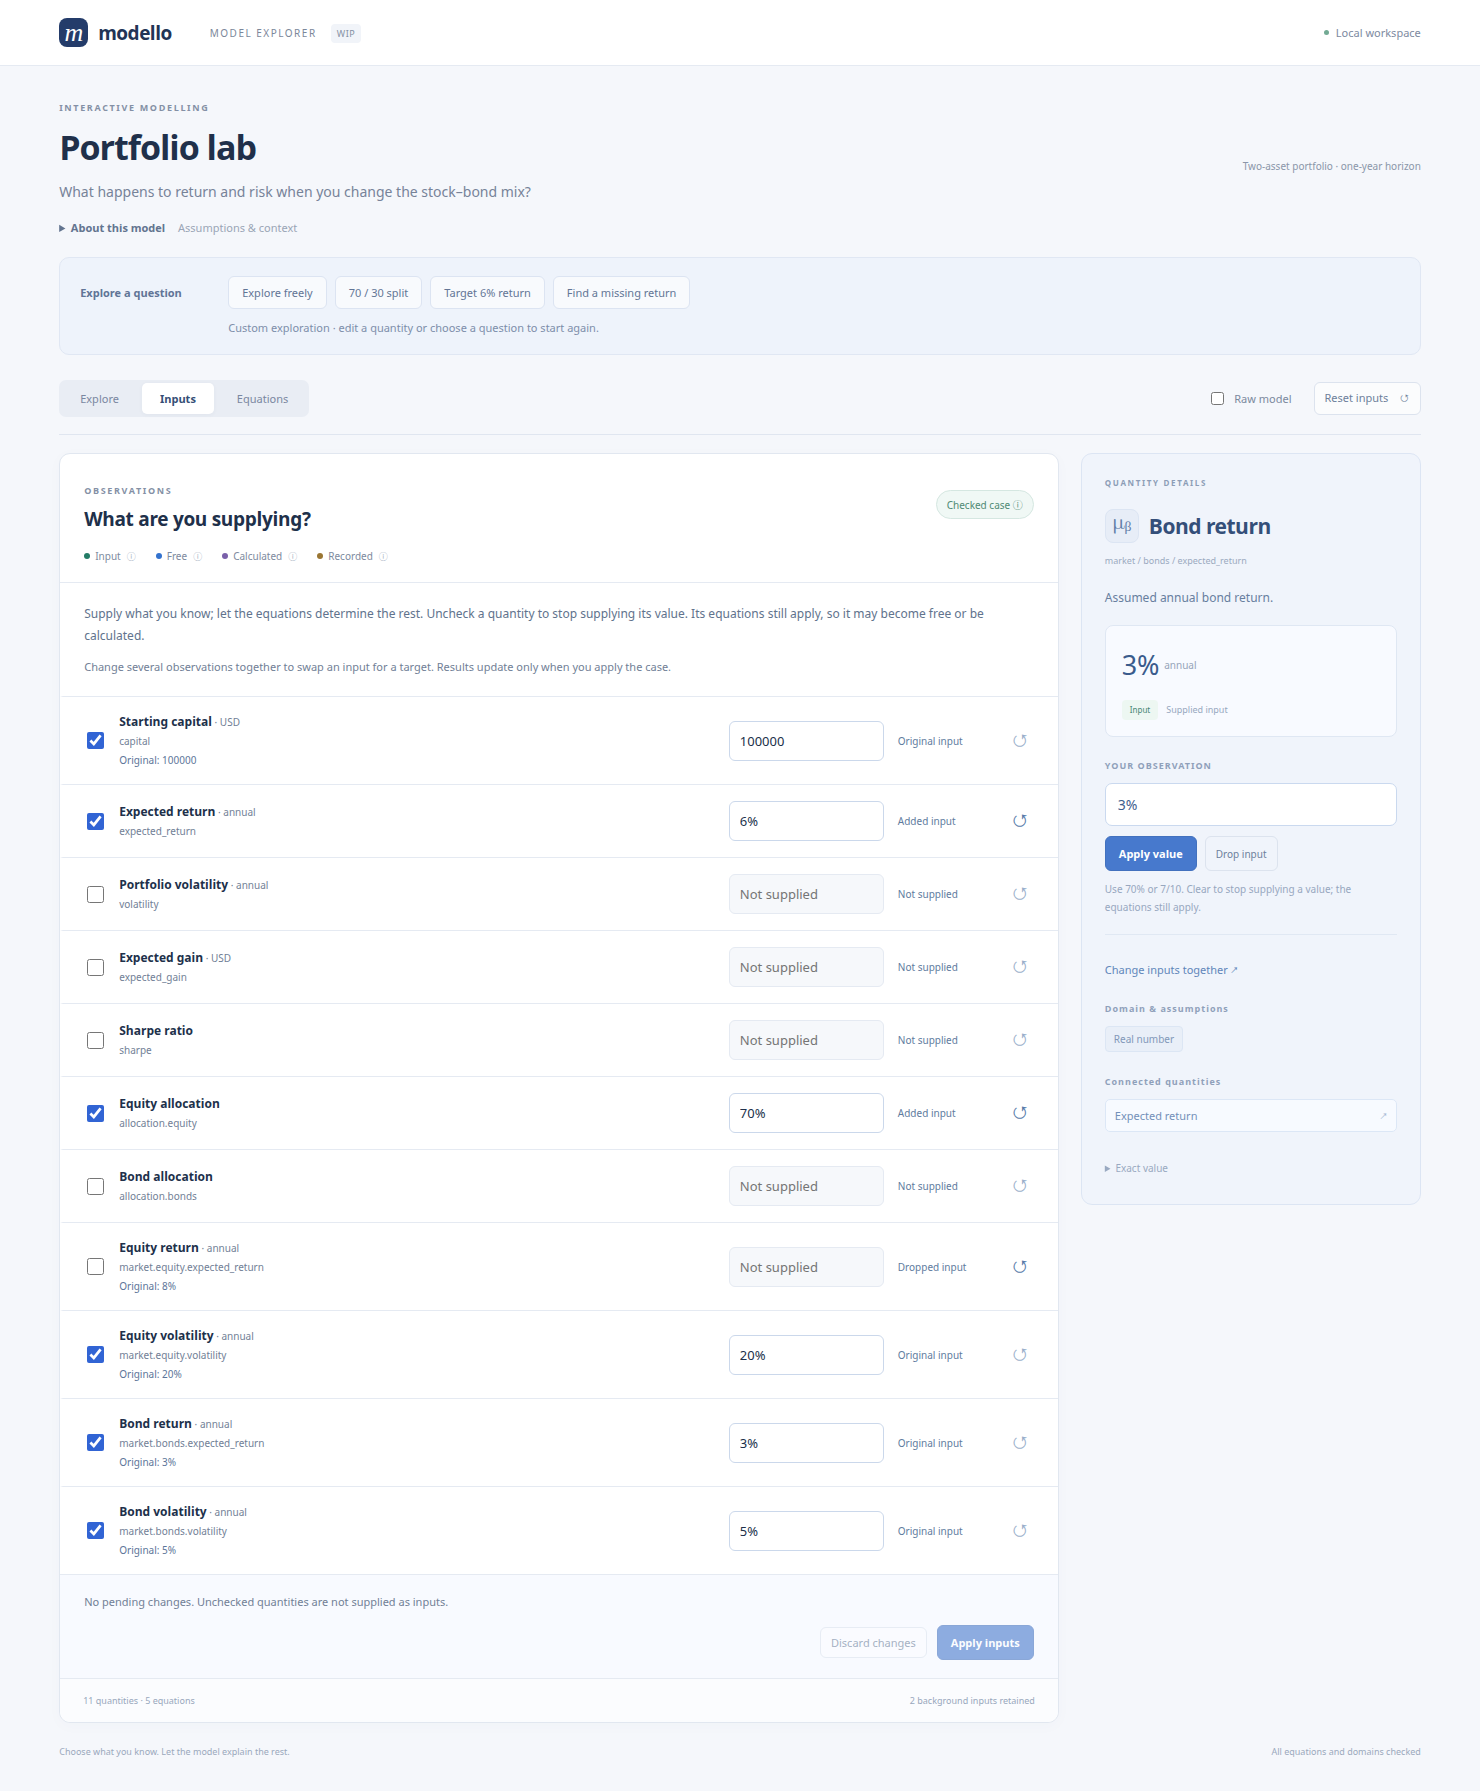
Understanding the interface
The colour key describes the source of a quantity, independently of whether its current value is numeric or symbolic:
Input is a supplied observation. It can be edited or released.
Free is an open quantity still represented by its own symbol.
Calculated follows from the model’s equations. A numeric result stays calculated and updates when its inputs change. A result can also be observed as a target, making it an input instead.
Recorded is a copied component result retained in a recorded problem. Its editor is disabled because that observation is held in the snapshot. Copying an unspecified quantity leaves it editable.
Hover or focus a colour key to read its explanation. Touch users can tap a key; tap elsewhere or press Escape to dismiss it. The case-status key also explains the distinction between a symbolic preview and a checked numerical case. Colour is accompanied by text labels throughout.
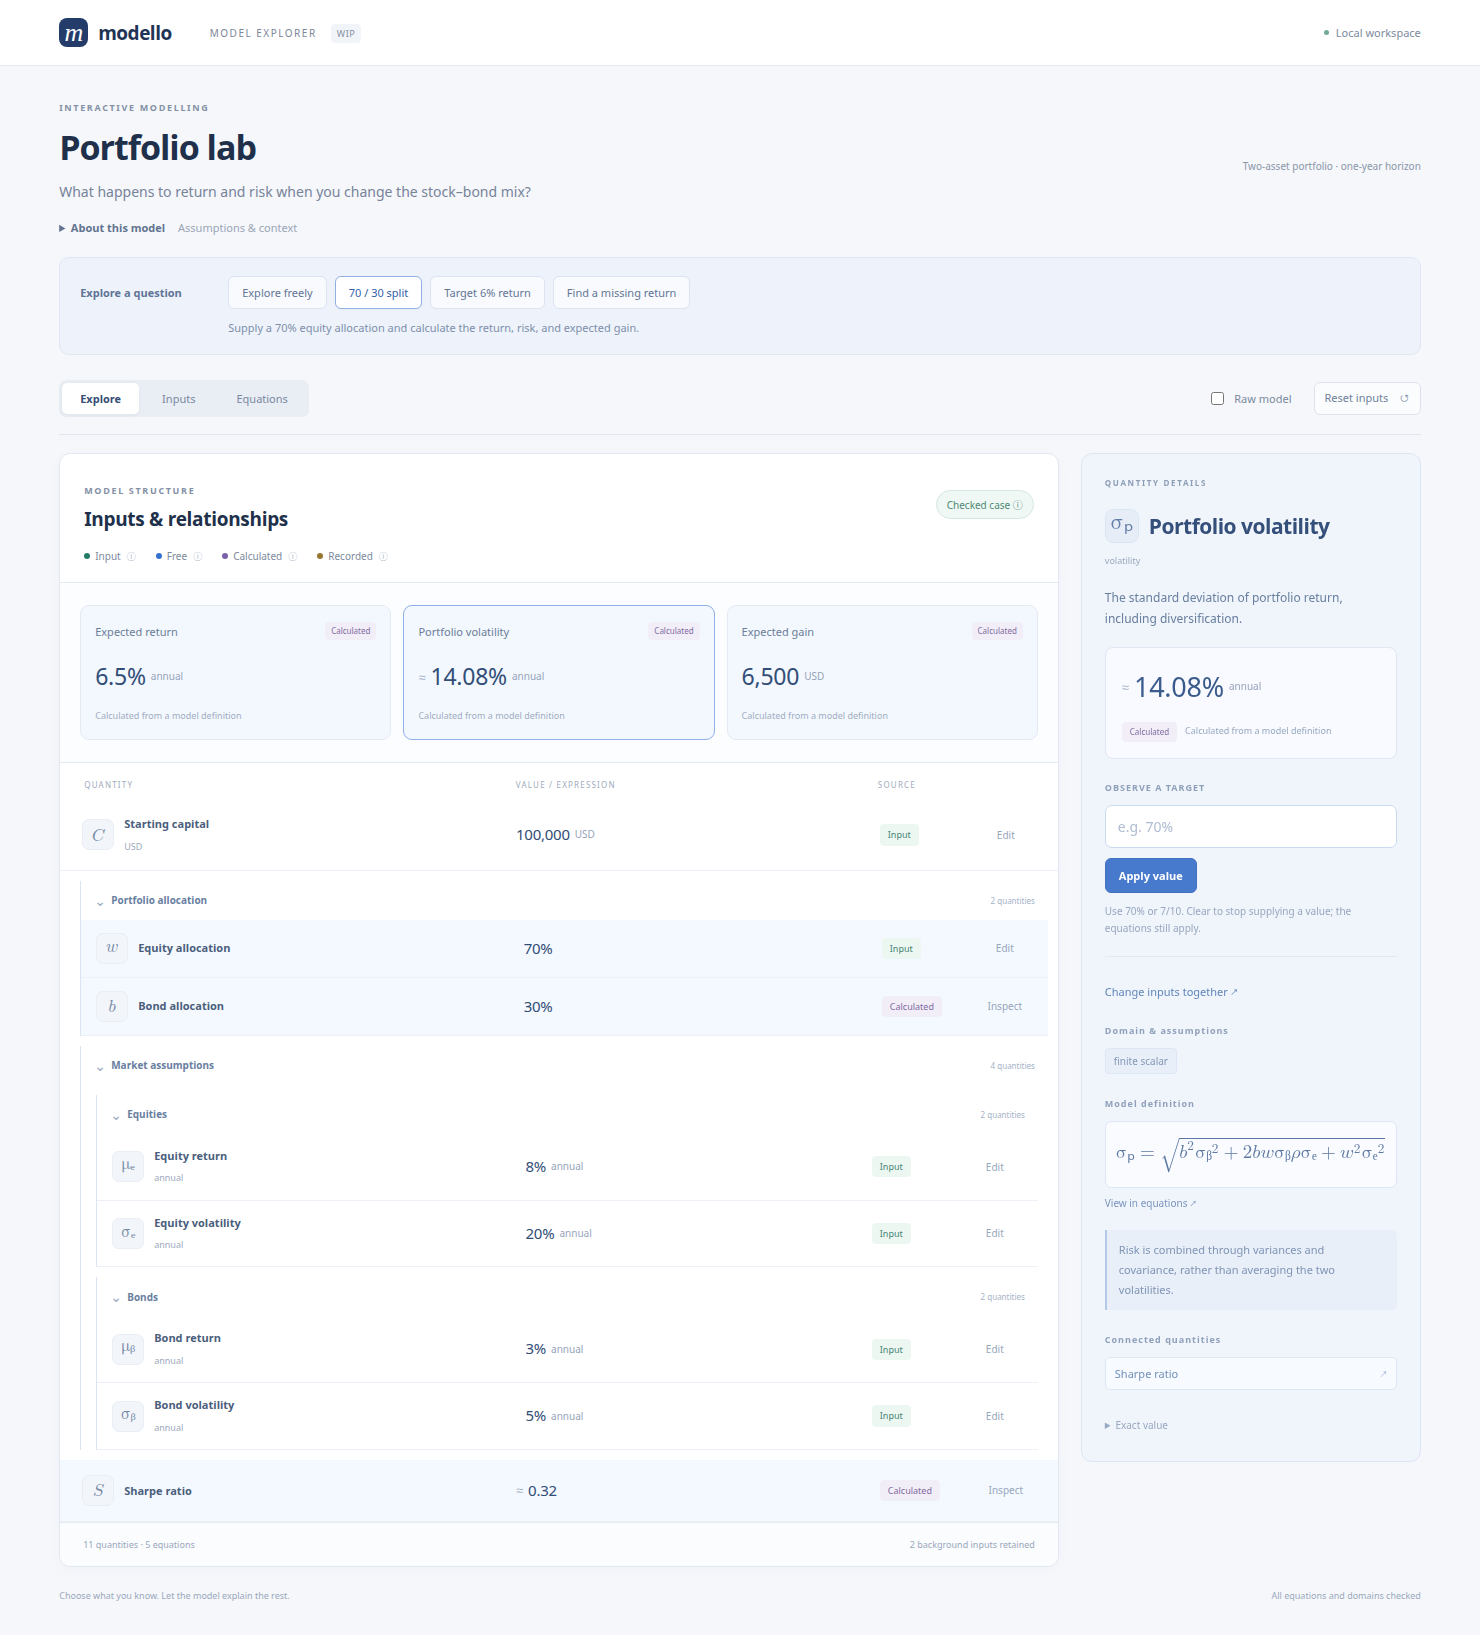
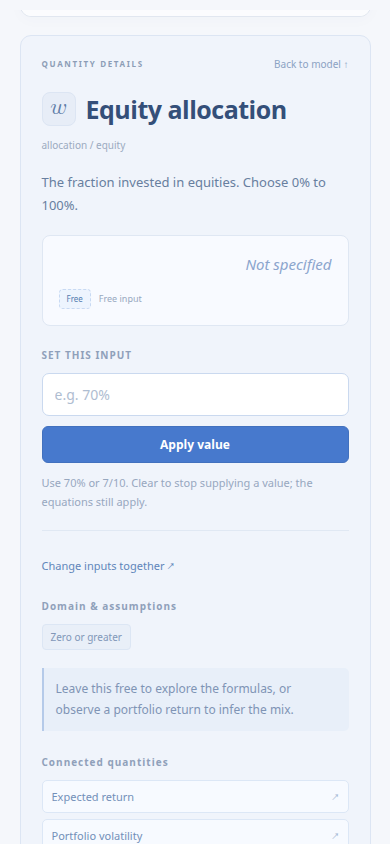
The inspector shows descriptions, units, source, domain chips, mathematical definitions, and links to connected quantities. Expressions use native MathML instead of printed Python or diagnostic constraint lines. Open View in equations for a definition that needs more room. Numeric displays use compact rounded values; an approximation sign marks rounding, and Exact value retains the underlying expression in the displayed units.
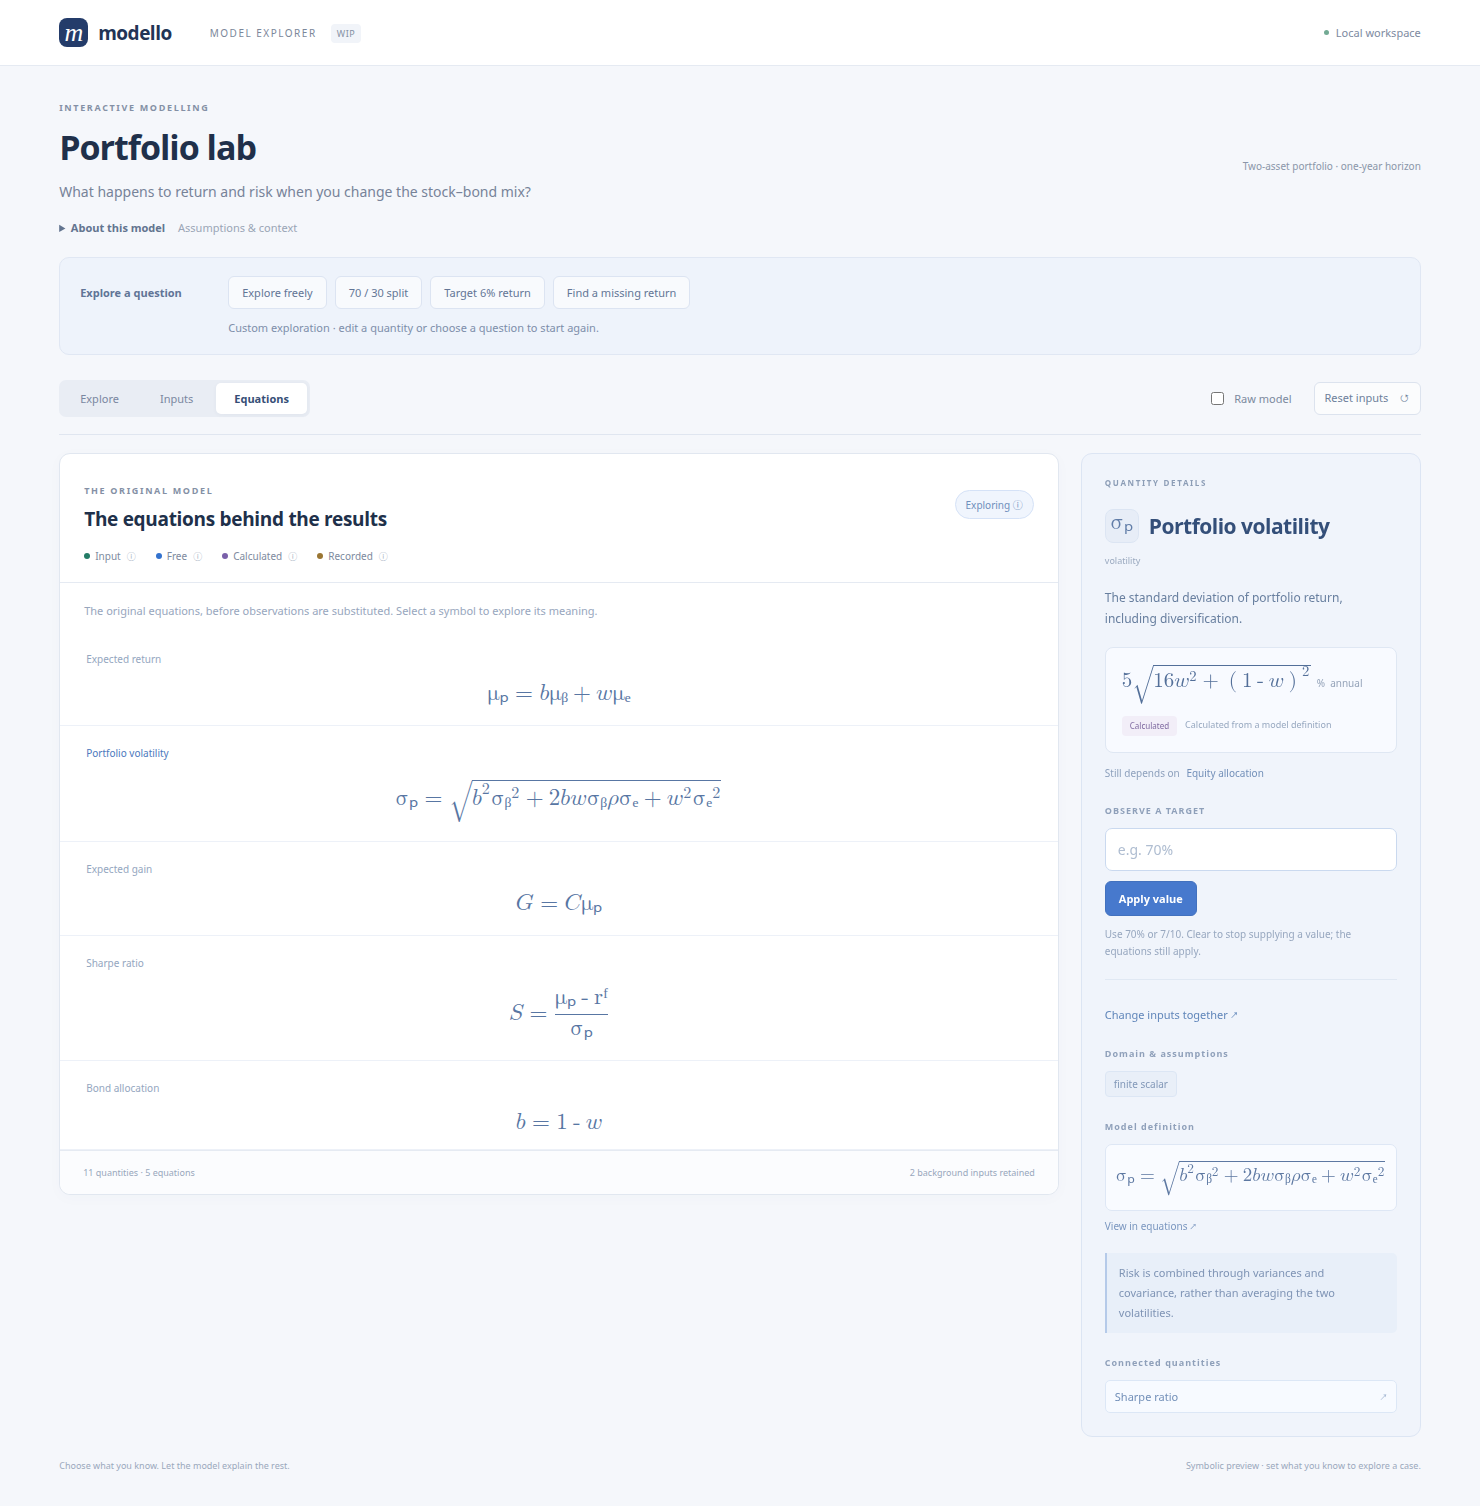
Raw model shows definitions without invoking the solver, retaining recorded inputs in the editor. Equations shows the original defining equations before observations are substituted. Hover, focus, or tap a symbol to inspect its path and description. Tab, Enter, and Space support keyboard exploration.
On narrow screens the inspector moves below the model. Selecting a quantity brings its details into view; Back to model returns to the quantities. Tooltip placement is clamped to the viewport.
Starting from your model
create_app accepts a model class, an existing instance, a recorded
ModelProblem, or a
SolutionFamily. Initial inputs use full dotted paths:
from modello.gui import create_app
from examples.gui import Portfolio, DEMO_INPUTS

app = create_app(Portfolio, "My portfolio", inputs=DEMO_INPUTS)
app.run(host="127.0.0.1", port=5058, debug=False)
With an instance, original inputs are reopened as observations and solved outputs are recomputed when inputs change. An overwritten instance field becomes an input, as with component copies. The source instance is never mutated. With a recorded problem, all its constraints remain, including inferred component observations. Observations that constrain quantities are labelled Recorded and held fixed; copying an unknown’s own symbol leaves it open. Reopen the instance when you want its outputs to recompute from original inputs. Each browser holds its own edits and cannot change another browser’s state.
Pass the family itself to retain where(...) filters, preferred coordinates,
and any section conditions. A model instance selected with one() contains
its observations and values, but does not retain the originating family’s
inequalities or section context:
>>> from examples.solution_families import ImpactStudy
>>> from modello.gui import Explorer
>>> from sympy import Rational
>>> explorer = Explorer(ImpactStudy.calibrated())
>>> initial = explorer.snapshot()
>>> initial["exploration"]["coordinate_count"]
1
>>> preview = explorer.snapshot(point={"impact": Rational(1, 2)})
>>> preview["status"], preview["exploration"]["coordinate_count"]
('checked', 1)
>>> next(field["value"] for field in preview["fields"] if field["path"] == "planned.cost")
'1051'
>>> chart = explorer.plot(controls=["impact"], output="planned.cost", windows={"impact": (Rational(1, 4), Rational(3, 4))})
>>> len(chart["points"]), chart["unknown"]
(41, 0)
Descriptions, units, and guided questions
Place presentation beside a field with gui(field, *, ...), as in the
quickstart. All metadata arguments are keyword-only, including direct
FieldInfo(...), ModelInfo(...), and Scenario(...) construction.
gui accepts an InstanceDummy, a calculated expression, or
component(Child). Decorate the class with @ModelInfo(...) for model-level
text and guided questions.
Use gui around the entire value assigned inside a Modello class body:
gain = gui(capital * expected_return, title="Expected gain"). The class
namespace unwraps the declaration before later expressions use the field
normally. This declaration helper is not an arithmetic wrapper; putting
gui(capital, ...) inside a larger calculation, or using its return value
outside that class scope, leaves the declaration uncollected.
Field metadata is a FieldInfo annotation. The core collects it through
the general Annotation mechanism; the solver never receives
GUI wrappers or metadata. Registry lookups are independent of Flask:
from modello.gui import FieldInfo

info = ReturnModel.__modello_annotations__[FieldInfo]["expected_return"]
assert info.title == "Expected return"
# A typed helper for extension consumers:
assert FieldInfo.for_model(ReturnModel)["expected_return"].symbol == "μ"
assert ModelInfo.for_model(ReturnModel)[""].title == "Return model"
Nested annotation paths are scoped automatically, such as
"market.equity.expected_return". Components retain their own declarations;
gui(component(Child), ...) labels that component in its parent. Class
docstrings supply default model and component descriptions. Model classes and
component instance types are preserved. See Extension annotations for
writing other extensions using the same registry.
For models declared elsewhere, a ModelInfo(fields=...) mapping can override
presentation by relative dotted path. Application-level metadata= overrides
take priority over that mapping, followed by inline annotations. Each override
replaces the whole FieldInfo for that path. Model presentation uses the
annotation registry; __gui__ blocks are rejected with a migration hint.
Presentation never changes the algebra.
highlights makes selected quantities prominent as result cards.
initial_field chooses the first inspector selection. A Scenario contains
trusted scalar observations and an optional field to select. Paths and edit
permissions are validated; a scenario cannot change hidden or Recorded values.
Its observations still pass through the same validation as manual edits.
Use None in a scenario’s bindings to drop a specific initial observation;
other initial observations remain active.
Scenario(bounds={"expected_return": (Rational(7, 200), None)}, ...)
adds a lower bound. Guided questions restore initial observations and replace
browser-added bounds; they retain any filters on a supplied source family.
ModelInfo(plot=...) opens an initial chart; Scenario(plot=...) opens one
for that guided question. Both accept a PlotInfo declaration:
from modello.gui import PlotInfo

ceiling = PlotInfo(
    controls=("x", "y"),
    output="height",
    windows={"x": (-40, 40), "y": (-40, 40)},
    view="surface",
)
The one or two controls and the output must be visible field paths. Window endpoints are increasing, finite real numbers in model units; percentage notation is generated for percentage editors. Windows affect only the picture. They do not add observations or bounds. The browser checks samples on opening the chart; serialising metadata or requesting a raw snapshot never solves it. Presets should select coordinates left free by the scenario. A preset for a larger family still needs a checked reference before taking a section.
Presentation paths are checked when constructing Explorer or create_app,
before serving any requests. Errors name the offending option or scenario,
include the full nested path, and suggest similar field names when available.
For example, a misspelt Scenario(title="Target", ...,
select="expected_retrn") reports Scenario 'Target'.select and suggests
'expected_return'. Initial input paths and snapshot bindings use the same
path checks. A scenario targeting hidden or Recorded data explains why the
quantity cannot be edited.
Repeating gui metadata on the same field or
ModelInfo on the same class raises ModelDefinitionError; subclasses
can explicitly refine inherited presentation in their own declaration scope.
symbol is literal text, including Unicode, rather than LaTeX. unit is a
display label without automatic unit conversion or dimensional analysis.
number_format="percent" displays fractional values in percent and seeds
the editor with percentage notation. Numeric summaries do not change exact
values or loosen validation.
A hidden field or component has no row or editor. Its original inputs remain in every solve, and the browser cannot replace or release them, including through aliases. Hidden observation values are omitted from the browser response; their public symbols and descriptions remain inspectable in formulas. This is presentation rather than a secrecy boundary: derived outputs and public model notes can reveal inputs.
Exact edits and validation
Editors accept numbers, +, -, *, /, **, sqrt(...), pi,
E, and I. A trailing % divides the whole expression by 100:
70% and 7/10 are the same exact value. 1.25 is exactly 5/4.
Input length, literal and arithmetic sizes, and powers are bounded. The parser
uses Python’s syntax tree without evaluating Python or SymPy expression strings.
Arbitrary functions, attribute access, and new parameter names are not accepted.
The trusted Python API continues to accept normal symbolic scalar inputs.
Proposed numerical cases are checked against original equations, all declared assumptions, and retained family filters, including domains of calculated and hidden quantities. Malformed values and directly invalid scalar inputs are rejected without replacing the applied results. Infeasible combinations are shown as empty families, with known substituted domain failures available for inspection. No arbitrary branch or sampled point is chosen when several solutions remain.
A unique symbolic proposal is labelled Exploring when its audit cannot establish a fully checked numeric case. This includes partially bound models and unresolved external parameters. It is not a claim that every remaining parameter value is admissible. Checked case requires a closed candidate satisfying every audit. Failure to produce a solver candidate is reported as failure to validate a case, not as proof of inconsistency.
Scope of this draft
The interface serves bundled HTML, CSS, JavaScript, and MathML without a CDN or JavaScript build. The local Flask server is intended for small trusted models on loopback. Symbolic work is synchronous; arithmetic limits are not a solver timeout. There is no deployment, authentication, persistence, or model-instance export flow. Case previews and pinned comparisons are kept in browser memory. Plotting explicitly checks a bounded sample of 41 points for one control or 11 by 11 for two; it does not continuously solve while dragging.
The GUI explores the exact solution family and uses its candidate audits.
Inputs outside the family’s supported exact-expression scope retain the prior
single-proposal preview, with the family limitation reported explicitly.
Ordinary construction keeps its existing solving behavior.
Python users can call Explorer(...).snapshot(raw=True)
for a solver-free, JSON-ready view without installing Flask. Snapshot kind
uses derived for both numeric and symbolic calculations and fixed only
for recorded component observations; value_state describes the display form.
Each visible field also reports initial_input and an input_state of
initial, overridden, added, dropped, or unspecified. This input
history is independent of whether the current value is free or calculated.
Hidden fields omit original values and report input_state="hidden".
Python snapshots are stateless proposals against the initial observations:
snapshot({"height": 6}) overrides height, and snapshot({"height": None})
drops it. Omitting height from the next proposal restores its original state.
Pass all desired overrides and drops together in one mapping. The browser
retains this mapping between edits and removes a field’s override when you
restore it individually.
snapshot(bounds={path: (lower, upper)}, case=index) selects one checked
finite alternative without changing the observations. Alternatively,
point={path: exact_value, ...} previews every remaining coordinate together.
Case indices belong to the current refinement and are reset after edits.
Bounds are stateless against the source family, so omitting them removes the
browser-added restrictions. Source-family conditions always remain active.
The exploration record reports coordinates, audited alternatives,
selection, active conditions, invariant outputs, and distinguishing quantities.
Each visible field’s possible_values retains its exact set separately from
the selected point’s displayed value.
API
Optional local exploration of nested models (install modello[gui]).
Presentation metadata never changes the algebra. Raw snapshots do not solve; browser edits are exact scalars parsed without evaluating expression strings.
- exception modello.gui.BindingError(message: str, paths: tuple[str, ...] = ())
A rejected edit, with field paths that the interface can highlight.
- class modello.gui.Explorer(model: type[Modello] | Modello | ModelProblem | SolutionFamily, name: str = 'exploration', *, inputs: Mapping[str, SymbolicScalar | int | float | complex | str | Decimal | Fraction] | None = None, metadata: Mapping[str, FieldInfo] | None = None)
Explore a class, instance, recorded problem, or solution family.
Declare model text with
@ModelInfo(...)and field labels withgui. Component declarations are inherited by the layout;metadataoverrides field or component labels by full dotted path.inputssupplies initial bindings by dotted path. The original model instance is never mutated.- snapshot(bindings: Mapping[str, SymbolicScalar | int | float | complex | str | Decimal | Fraction | None] | None = None, *, raw: bool = False, bounds: Mapping[str, tuple[SymbolicScalar | int | float | complex | str | Decimal | Fraction | None, SymbolicScalar | int | float | complex | str | Decimal | Fraction | None]] | None = None, case: int | None = None, point: Mapping[str, SymbolicScalar | int | float | complex | str | Decimal | Fraction] | None = None) dict[str, Any]
Return a JSON-ready view; invalid edits raise without changing state.
Bindings replace initial inputs, and
Nonedrops an observation without removing definitions. Omit a path to restore its initial input state. Several bindings are checked together as one proposed case. Raw views show definitions without solving. Bound views label an undecided audit as a conditional preview.
- plot(bindings: Mapping[str, SymbolicScalar | int | float | complex | str | Decimal | Fraction | None] | None = None, *, controls: Sequence[str], output: str, windows: Mapping[str, Sequence[SymbolicScalar | int | float | complex | str | Decimal | Fraction]], bounds: Mapping[str, tuple[SymbolicScalar | int | float | complex | str | Decimal | Fraction | None, SymbolicScalar | int | float | complex | str | Decimal | Fraction | None]] | None = None, case: int | None = None, point: Mapping[str, SymbolicScalar | int | float | complex | str | Decimal | Fraction] | None = None) dict[str, Any]
Return checked samples of one or two coordinates, or a reference section.
Windows are display choices, not observations. Omitted coordinates require a checked reference. Rejected or undecided samples never establish emptiness.
- class modello.gui.FieldInfo(*, title: str = '', description: str = '', info: str = '', symbol: str = '', hidden: bool = False, unit: str = '', number_format: Literal['number', 'percent'] = 'number')
Display metadata for a scalar or component, without changing its algebra.
All metadata arguments are keyword-only.
symbolis literal MathML text, not LaTeX.hiddenremoves the editor and observation value while retaining its inputs. Calculated outputs can still reveal input values; hiding is a presentation choice.unitis a display label;number_format='percent'renders fractions as percentages.
- class modello.gui.ModelInfo(*, title: str = '', description: str = '', info: str = '', fields: Mapping[str, ~modello.gui.FieldInfo]=<factory>, highlights: tuple[str, ...]=(), initial_field: str = '', scenarios: tuple[~modello.gui.Scenario, ...]=(), plot: PlotInfo | None = None)
Decorate a model with its text and exploration hints.
Use
@ModelInfo(title=..., ...)above the class. Declare field metadata inline withgui. Optionalfieldskeys are relative dotted paths for presentation overrides, including labels on components from other models.highlightsselects result cards,initial_fieldopens an inspector, andscenariossupplies named explorations from the initial inputs. All metadata arguments are keyword-only.
- class modello.gui.PlotInfo(*, controls: tuple[str, ...], output: str, windows: Mapping[str, tuple[SymbolicScalar | int | float | complex | str | Decimal | Fraction, SymbolicScalar | int | float | complex | str | Decimal | Fraction]], view: Literal['map', 'surface'] = 'map')
An initial chart of one or two controls, with display windows in model units.
Windows do not constrain the family.
viewselects a flat map or a rotatable surface for two controls; one control always gives a curve. The browser checks the samples when this exploration is opened.
- class modello.gui.Scenario(*, title: str, description: str, bindings: Mapping[str, ~modello._model.SymbolicScalar | int | float | complex | str | ~decimal.Decimal | ~fractions.Fraction | None]=<factory>, bounds: Mapping[str, tuple[~modello._model.SymbolicScalar | int | float | complex | str | ~decimal.Decimal | ~fractions.Fraction | None, ~modello._model.SymbolicScalar | int | float | complex | str | ~decimal.Decimal | ~fractions.Fraction | None]]=<factory>, select: str = '', plot: PlotInfo | None = None)
A named exploration that restores initial inputs, then applies bindings.
All arguments are named. Only visible, editable quantities may be bound.
selectopens a field in the inspector; it need not be the quantity being observed.
- modello.gui.create_app(model: type[Modello] | Modello | ModelProblem | SolutionFamily, name: str = 'exploration', *, inputs: Mapping[str, ScalarValue] | None = None, metadata: Mapping[str, FieldInfo] | None = None) Flask
Create a local Flask app; each browser holds its own trial bindings.
Serve with
app.run(host='127.0.0.1', debug=False). The bundled frontend needs no CDN, JavaScript build, or external math renderer. The prototype runs symbolic work synchronously and is intended for small local models.
- modello.gui.gui(field: _ValueT, *, title: str = '', description: str = '', info: str = '', symbol: str = '', hidden: bool = False, unit: str = '', number_format: Literal['number', 'percent'] = 'number') _ValueT
Annotate a scalar or component declaration without changing its type.
Wrap the entire assigned value:
field = gui(expression, title=...)inside a Modello class body. The class namespace unwraps the declaration before later expressions use it; this helper is not an arithmetic wrapper outside that scope. Metadata is stored underModel.__modello_annotations__[FieldInfo].